
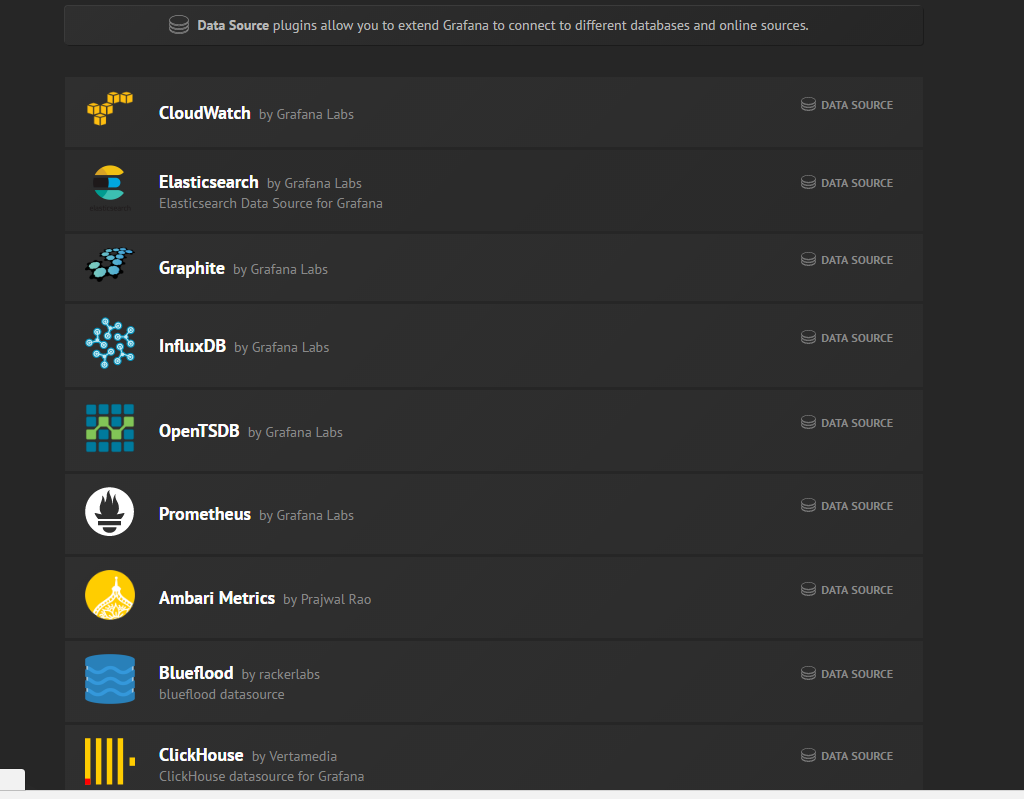
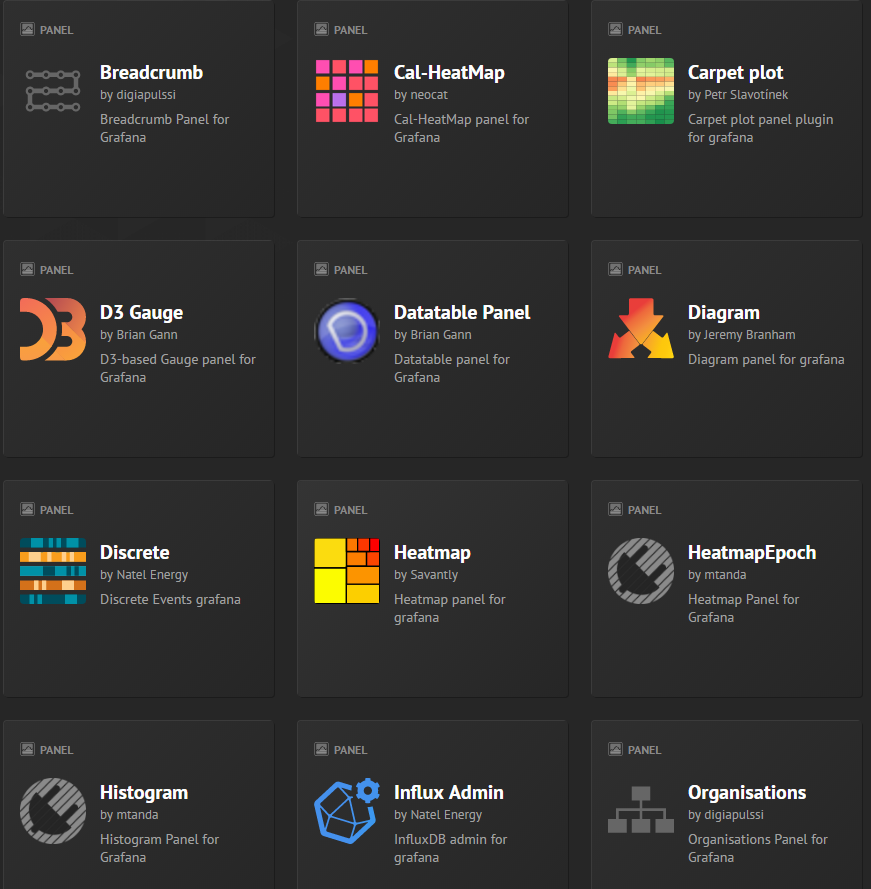
#1.什么是Grafana? 漂亮的开放平台 分析和监控。无论你的数据在哪里,或者是什么样的数据库,都可以和Grafana一起精美使用。截至目前版本:4.3.2为止,共支持25个数据源,25个面板,15个应用程序和345个仪表板。
25个数据源


25个面板


15个应用程序
详见:https://grafana.com/plugins?type=app
345个仪表板
详见:https://grafana.com/dashboards
2.下载windows版Grafana
https://grafana.com/grafana/download?platform=windows
https://s3-us-west-2.amazonaws.com/grafana-releases/release/grafana-4.3.1.windows-x64.zip
3.配置Grafana!
下载完后会有一个zip文件。zip文件包含一个包含当前Grafana版本的文件夹。
1.进入conf目录并将sample.ini复制到custom.ini。您应该编辑custom.ini,决不能修改defaults.ini。默认grafana端口为:3000。 编辑custom.ini并取消注释http_port配置选项,并将其更改为8080或类似的内容。该端口不应该需要额外的Windows权限。
2.通过执行grafana-server.exe,最好从命令行启动Grafana。如果要运行Grafana作为Windows服务,请下载https://nssm.cc/。使用该工具将Grafana添加为Windows服务非常简单.
3.默认用户为admin,默认密码为admin
1)配置文件位置
- 默认配置从$ WORKING_DIR / conf / defaults.ini
- 自定义配置从$ WORKING_DIR / conf / custom.ini
-
可以使用–config参数覆盖自定义配置文件路径
注意。如果您使用deb或rpm软件包安装了Grafana,那么您的配置文件位于/etc/grafana/grafana.ini。此路径在Grafana init.d脚本中使用–config文件参数指定
2)使用环境变量
配置文件中的所有选项(如下所列)可以使用以下语法覆盖环境变量:
GF_
_
部分名称是括号内的文本。一切都应该是大写的,”.”应由” _ “替代例如,给定这些配置设置:
# default section
instance_name = ${HOSTNAME}

[security]
admin_user = admin

[auth.google]
client_secret = 0ldS3cretKey 然后可以使用以下方式覆盖它们:

export GF_DEFAULT_INSTANCE_NAME=my-instance
export GF_SECURITY_ADMIN_USER=true
export GF_AUTH_GOOGLE_CLIENT_SECRET=newS3cretKey
3)配置文件(3.0.4)解析如下:
	##################### Grafana Configuration Example #####################
	#
	# Everything has defaults so you only need to uncomment things you want to
	# change

	# possible values : production, development
	; app_mode = production

	#################################### Paths ####################################
	[paths]
	#一个grafana用来存储sqlite3、临时文件、回话的地址路径 Path to where grafana can store temp files, sessions, and the sqlite3 db (if that is used)
	#
	;data = /var/lib/grafana
	#
	# grafana存储logs的路径Directory where grafana can store logs
	#
	;logs = /var/log/grafana
	#
	# Directory where grafana will automatically scan and look for plugins
	#
	;plugins = /var/lib/grafana/plugins

	#
	#################################### Server ####################################
	[server]
	# Protocol (http or https)
	;protocol = http

	#监听的ip地址,,默认是0.0.0.0 The ip address to bind to, empty will bind to all interfaces
	;http_addr =

	#监听的端口,默认是3000 The http port  to use
	;http_port = 8080

	# 这个设置是root_url的一部分,当你通过浏览器访问grafana时的公开的domian名称,默认是localhostThe public facing domain name used to access grafana from a browser
	;domain = localhost

	#如果主机的header不匹配domian,则跳转到一个正确的domain上,默认是false Redirect to correct domain if host header does not match domain
	# Prevents DNS rebinding attacks
	;enforce_domain = false

	#这是一个web上访问grafana的全路径url,默认是%(protocol)s://%(domain)s:%(http_port)s/ The full public facing url
	;root_url = %(protocol)s://%(domain)s:%(http_port)s/

	#是否记录web请求日志,默认是false Log web requests
	;router_logging = false

	# 前端文件(HTML,JS和CSS文件)目录的路径。默认为public,这就是为什么Grafana二进制文件需要执行的工作目录设置为安装路径。the path relative working path
	;static_root_path = public

	# enable gzip
	;enable_gzip = false

	# 如果使用https则需要设置https certs & key file
	;cert_file =
	;cert_key =

	#################################### Database ####################################
	[database]
	#默认需要使用数据库存储用户和dashboard信息,默认使用sqlite3来存储,你也可以换成其他数据库可以是mysql、postgres、sqlite3,默认是sqlite3 Either "mysql", "postgres" or "sqlite3", it's your choice
	#host:只是mysql、postgres需要,默认是127.0.0.1:3306   name:grafana的数据库名称,默认是grafana  user:连接数据库的用户
	#password:数据库用户的密码  ssl_mode:只是postgres使用
	;type = sqlite3
	;host = 127.0.0.1:3306
	;name = grafana
	;user = root
	;password =

	# For "postgres" only, either "disable", "require" or "verify-full"
	;ssl_mode = disable

	#只是sqlite3需要,定义sqlite3的存储路径 For "sqlite3" only, path relative to data_path setting
	;path = grafana.db

	#################################### Session ####################################
	[session]
	# Either "memory", "file", "redis", "mysql", "postgres", default is "file"
	#默认是file,值还可以是memory、mysql、postgres
	;provider = file

	# Provider config options
	# memory: not have any config yet
	# file: session dir path, is relative to grafana data_path
	# redis: config like redis server e.g. `addr=127.0.0.1:6379,pool_size=100,db=grafana`
	# mysql: go-sql-driver/mysql dsn config string, e.g. `user:password@tcp(127.0.0.1:3306)/database_name`
	# postgres: user=a password=b host=localhost port=5432 dbname=c sslmode=disable
	#这个值的配置由provider的设置来确定,如果provider是file,则是data/xxxx路径类型,如果provider是mysql,则是user:password@tcp(127.0.0.1:3306)/database_name,如果provider是postgres,则是user=a password=b host=localhost port=5432 dbname=c sslmode=disable
	;provider_config = sessions

	# Session cookie name
	#grafana的cookie名称
	;cookie_name = grafana_sess

	# If you use session in https only, default is false
	#如果设置为true,则grafana依赖https,默认是false
	;cookie_secure = false

	# Session life time, default is 86400
	#session过期时间,默认是86400秒,24小时
	;session_life_time = 86400

	#################################### Analytics ####################################
	[analytics]
	# Server reporting, sends usage counters to stats.grafana.org every 24 hours.
	# No ip addresses are being tracked, only simple counters to track
	# running instances, dashboard and error counts. It is very helpful to us.
	# Change this option to false to disable reporting.
	;reporting_enabled = true

	# Set to false to disable all checks to https://grafana.net
	# for new vesions (grafana itself and plugins), check is used
	# in some UI views to notify that grafana or plugin update exists
	# This option does not cause any auto updates, nor send any information
	# only a GET request to http://grafana.net to get latest versions
	#如果设置为true,则会发送匿名使用分析到stats.grafana.org,主要用于跟踪允许实例、版本、dashboard、错误统计。默认是true
	;check_for_updates = true

	# Google Analytics universal tracking code, only enabled if you specify an id here
	#使用GA进行分析,填写你的GA ID即可
	;google_analytics_ua_id =

	#################################### Security ####################################
	[security]
	#grafana默认的admin用户,默认是admin default admin user, created on startup
	;admin_user = admin

	#grafana admin的默认密码,默认是admin default admin password, can be changed before first start of grafana,  or in profile settings
	;admin_password = admin

	#secret_key:保持登录状态的签名 used for signing
	;secret_key = SW2YcwTIb9zpOOhoPsMm

	#login_remember_days:多少天内保持登录状态 Auto-login remember days
	;login_remember_days = 7
	;cookie_username = grafana_user
	;cookie_remember_name = grafana_remember

	# 设置为true可禁用Gravatar对用户配置文件图像的使用。默认值为false。disable gravatar profile images
	;disable_gravatar = false

	# 定义允许的ips /域在数据源中使用的白名单。格式:ip_or_domain:以空格分隔的端口data source proxy whitelist (ip_or_domain:port seperated by spaces)
	;data_source_proxy_whitelist =

	[snapshots]
	# snapshot sharing options
	;external_enabled = true
	;external_snapshot_url = https://snapshots-origin.raintank.io
	;external_snapshot_name = Publish to snapshot.raintank.io

	#################################### Users ####################################
	[users]
	# 是否允许普通用户登录,如果设置为false,则禁止用户登录,默认是true,则admin可以创建用户,并登录grafana  disable user signup / registration
	;allow_sign_up = true

	#如果设置为false,则禁止用户创建新组织,默认是true Allow non admin users to create organizations
	;allow_org_create = true

	# 当设置为true的时候,会自动的把新增用户增加到id为1的组织中,当设置为false的时候,新建用户的时候会新增一个组织Set to true to automatically assign new users to the default organization (id 1)
	;auto_assign_org = true

	#新建用户附加的规则,默认是Viewer,还可以是Admin、Editor, Default role new users will be automatically assigned (if disabled above is set to true)
	;auto_assign_org_role = Viewer

	# Background text for the user field on the login page
	;login_hint = email or username

	#################################### Anonymous Auth ##########################
	[auth.anonymous]
	#设置为true,则开启允许匿名访问,默认是false enable anonymous access
	;enabled = false

	#为匿名用户设置组织名称 specify organization name that should be used for unauthenticated users
	;org_name = Main Org.

	#为匿名用户设置的访问规则,默认是Viewer specify role for unauthenticated users
	;org_role = Viewer

	#################################### Github Auth ##########################
	[auth.github]
	;enabled = false
	;allow_sign_up = false
	;client_id = some_id
	;client_secret = some_secret
	;scopes = user:email,read:org
	;auth_url = https://github.com/login/oauth/authorize
	;token_url = https://github.com/login/oauth/access_token
	;api_url = https://api.github.com/user
	;team_ids =
	;allowed_organizations =

	#################################### Google Auth ##########################
	[auth.google]
	;enabled = false
	;allow_sign_up = false
	;client_id = some_client_id
	;client_secret = some_client_secret
	;scopes = https://www.googleapis.com/auth/userinfo.profile https://www.googleapis.com/auth/userinfo.email
	;auth_url = https://accounts.google.com/o/oauth2/auth
	;token_url = https://accounts.google.com/o/oauth2/token
	;api_url = https://www.googleapis.com/oauth2/v1/userinfo
	;allowed_domains =

	#################################### Auth Proxy ##########################
	[auth.proxy]
	#允许你在一个HTTP反向代理上进行认证设置
	;enabled = false
	;header_name = X-WEBAUTH-USER
	;header_property = username
	#默认是true。开启自动注册,如果用户在grafana DB中不存在
	;auto_sign_up = true

	#################################### Basic Auth ##########################
	[auth.basic]
	#当设置为true,则http api开启基本认证
	;enabled = true

	#################################### Auth LDAP ##########################
	[auth.ldap]
	#设置为true则开启LDAP认证,默认是false
	;enabled = false
	#如果开启LDAP,指定LDAP的配置文件/etc/grafana/ldap.toml
	;config_file = /etc/grafana/ldap.toml

	#################################### SMTP / Emailing ##########################
	[smtp]
	;enabled = false
	;host = localhost:25
	;user =
	;password =
	;cert_file =
	;key_file =
	;skip_verify = false
	;from_address = admin@grafana.localhost

	[emails]
	;welcome_email_on_sign_up = false

	#################################### Logging ##########################
	[log]
	# Either "console", "file", "syslog". Default is console and  file
	# Use comma to separate multiple modes, e.g. "console, file"
	#可以是console、file,默认是console、file,也可以设置多个,用逗号隔开
	;mode = console, file

	# Buffer length of channel, keep it as it is if you don't know what it is.
	#channel的buffer长度,默认是10000
	;buffer_len = 10000

	# Either "Trace", "Debug", "Info", "Warn", "Error", "Critical", default is "Info"
	#可以是"Trace", "Debug", "Info", "Warn", "Error", "Critical",默认是info
	;level = Info

	# For "console" mode only
	#level:设置级别
	[log.console]
	;level =

	# For "file" mode only
	[log.file]
	#level:设置级别
	;level =
	# This enables automated log rotate(switch of following options), default is true
	#log_rotate:是否开启自动轮转
	;log_rotate = true

	# Max line number of single file, default is 1000000
	#max_lines:单个日志文件的最大行数,默认是1000000
	;max_lines = 1000000

	# Max size shift of single file, default is 28 means 1 << 28, 256MB
	#max_lines_shift:单个日志文件的最大大小,默认是28,表示256MB
	;max_lines_shift = 28

	# Segment log daily, default is true
	#每天是否进行日志轮转,默认是true
	;daily_rotate = true

	# Expired days of log file(delete after max days), default is 7
	#日志过期时间,默认是7,7天后删除
	;max_days = 7

	#################################### AMPQ Event Publisher ##########################
	[event_publisher]
	;enabled = false
	;rabbitmq_url = amqp://localhost/
	;exchange = grafana_events

	;#################################### Dashboard JSON files ##########################
	[dashboards.json]
	#如果你有一个系统自动产生json格式的dashboard,则可以开启这个特性试试
	;enabled = false
	#一个全路径用来包含你的json dashboard,默认是/var/lib/grafana/dashboards
	;path = /var/lib/grafana/dashboards